Gojek
How might we reduce pickup anxiety during the customer pick-up process?
Role
Product Designer, Intern
Period
Summer 2021
Team
Transport Team
As a Product Design Intern within Gojek’s Transport Team which manages the ride-hailing services for cars and motorcycles, I had the rare opportunity to address a critical issue: high cancellation rates during the ride-hailing process. Under the guidance of my mentor, Idwan Ula, I led the design efforts to tackle this issue. This project was part of an ongoing initiative to improve the fundamental quality of the live tracking experience and was a key focus for Gojek in Q3 & Q4 2021.
Background
Imagine if Uber, Doordash, Amazon, & Square is combined into one super-app. That’s Gojek.
It is one of the biggest tech companies in Asia with $20 billion market share. 140+ million users across 4 countries.

Problem
High cancellation rates during the ride-hailing process.
Frequent ride cancellations disrupted driver schedules, frustrated users, and weakened trust in the platform. Beyond the user impact, they also led to millions in lost revenue and reduced efficiency. This project aimed to ease pickup anxiety and improve the ride-hailing experience to lower cancellations.

Objective
Lay the foundation to reduce cancellations. Increase trust between drivers & customers.
To tackle high ride cancellations, Gojek planned a three-phase approach. This project marks Phase 1, focusing on small but impactful initiatives to ease pickup anxiety and improve user trust.
OKR for this phase is 15% reduction in cancellations. Future phases will introduce larger systemic changes to further optimize the ride-hailing experience and reduce cancellations at scale.
Research
We set out to understand when and why users cancel their rides.
Surveys & Interviews
Gathered quantitative and qualitative data from the survey in the cancellation flow as well as virtual userbase interviews to understand their experiences, expectations, and reasons for canceling rides.
Contextual Inquiries
Observed users in real-world settings to gain in-depth insights into their behaviors and challenges during the ride-hailing process (Indonesia only).
Journey Mapping
Visualized the entire user experience from booking to ride completion to identify possible pain points and moments of frustration.
A/B Testing
Compared different versions of the live tracking screen to determine which elements improved user satisfaction and reduced cancellations (Indonesia only).
What We Found
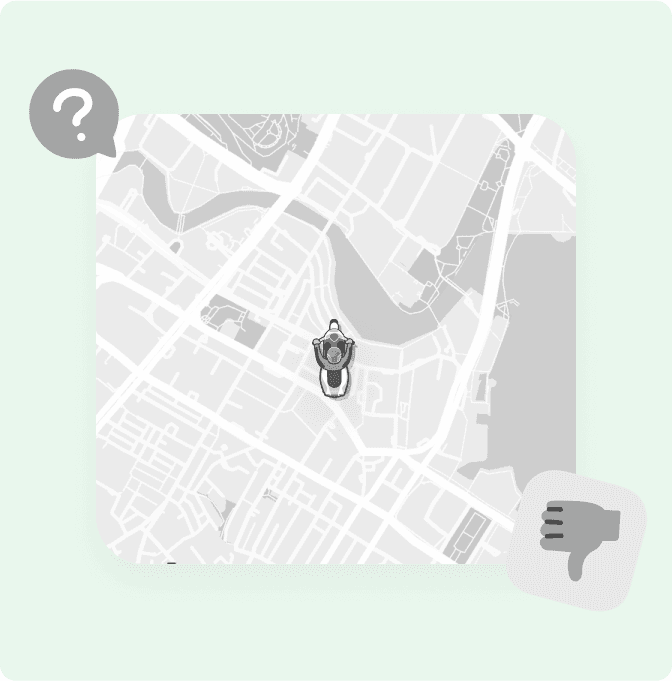
Users are most likely to cancel orders during high-stake trips due to various anxiety triggers.
Users in Indonesia (ID) and Singapore (SG) often experience pickup anxiety during high-stake trips, such as commuting to work, rushing to appointments, or navigating first mile/last mile (FM/LM) connections, especially during busy weekday hours.
These trips involve significant responsibilities and time sensitivity, making delays particularly stressful. Participants reported several anxiety-triggering situations during the ride-hailing process such as:
Long ETA
Expected at busy hours, but still causes anxiety.
Driver not moving
When the driver's location seems static.
Driver distance too far
Often happens when ordering from residential areas.
Long actual waiting time
When the actual wait time is longer than the ETA.
Key Insight
There are 3 main reasons behind most cancellations.


Approach
Finding the right balance of effective, simple, and cost-efficient.
We explored multiple design approaches, including preset driver messages to keep users updated via chat and a robust push notification system for real-time updates. While these options were informative, preset messages added to driver workload and posed safety risks, while notifications risked overwhelming users.
Ultimately, we landed on microinteractions as the best solution, offering simplicity, contextual relevance, and cost-efficiency.
Triggers & Rules
Defining the conditions & framework for effective microinteractions.
Triggers are used to address specific situations that users commonly encounter during the ride-hailing process, while rules help manage the complexity and relevance of the information presented to users. This end logic was achieved through collaboration between designers, researchers, data scientists, and backend engineers.


Design
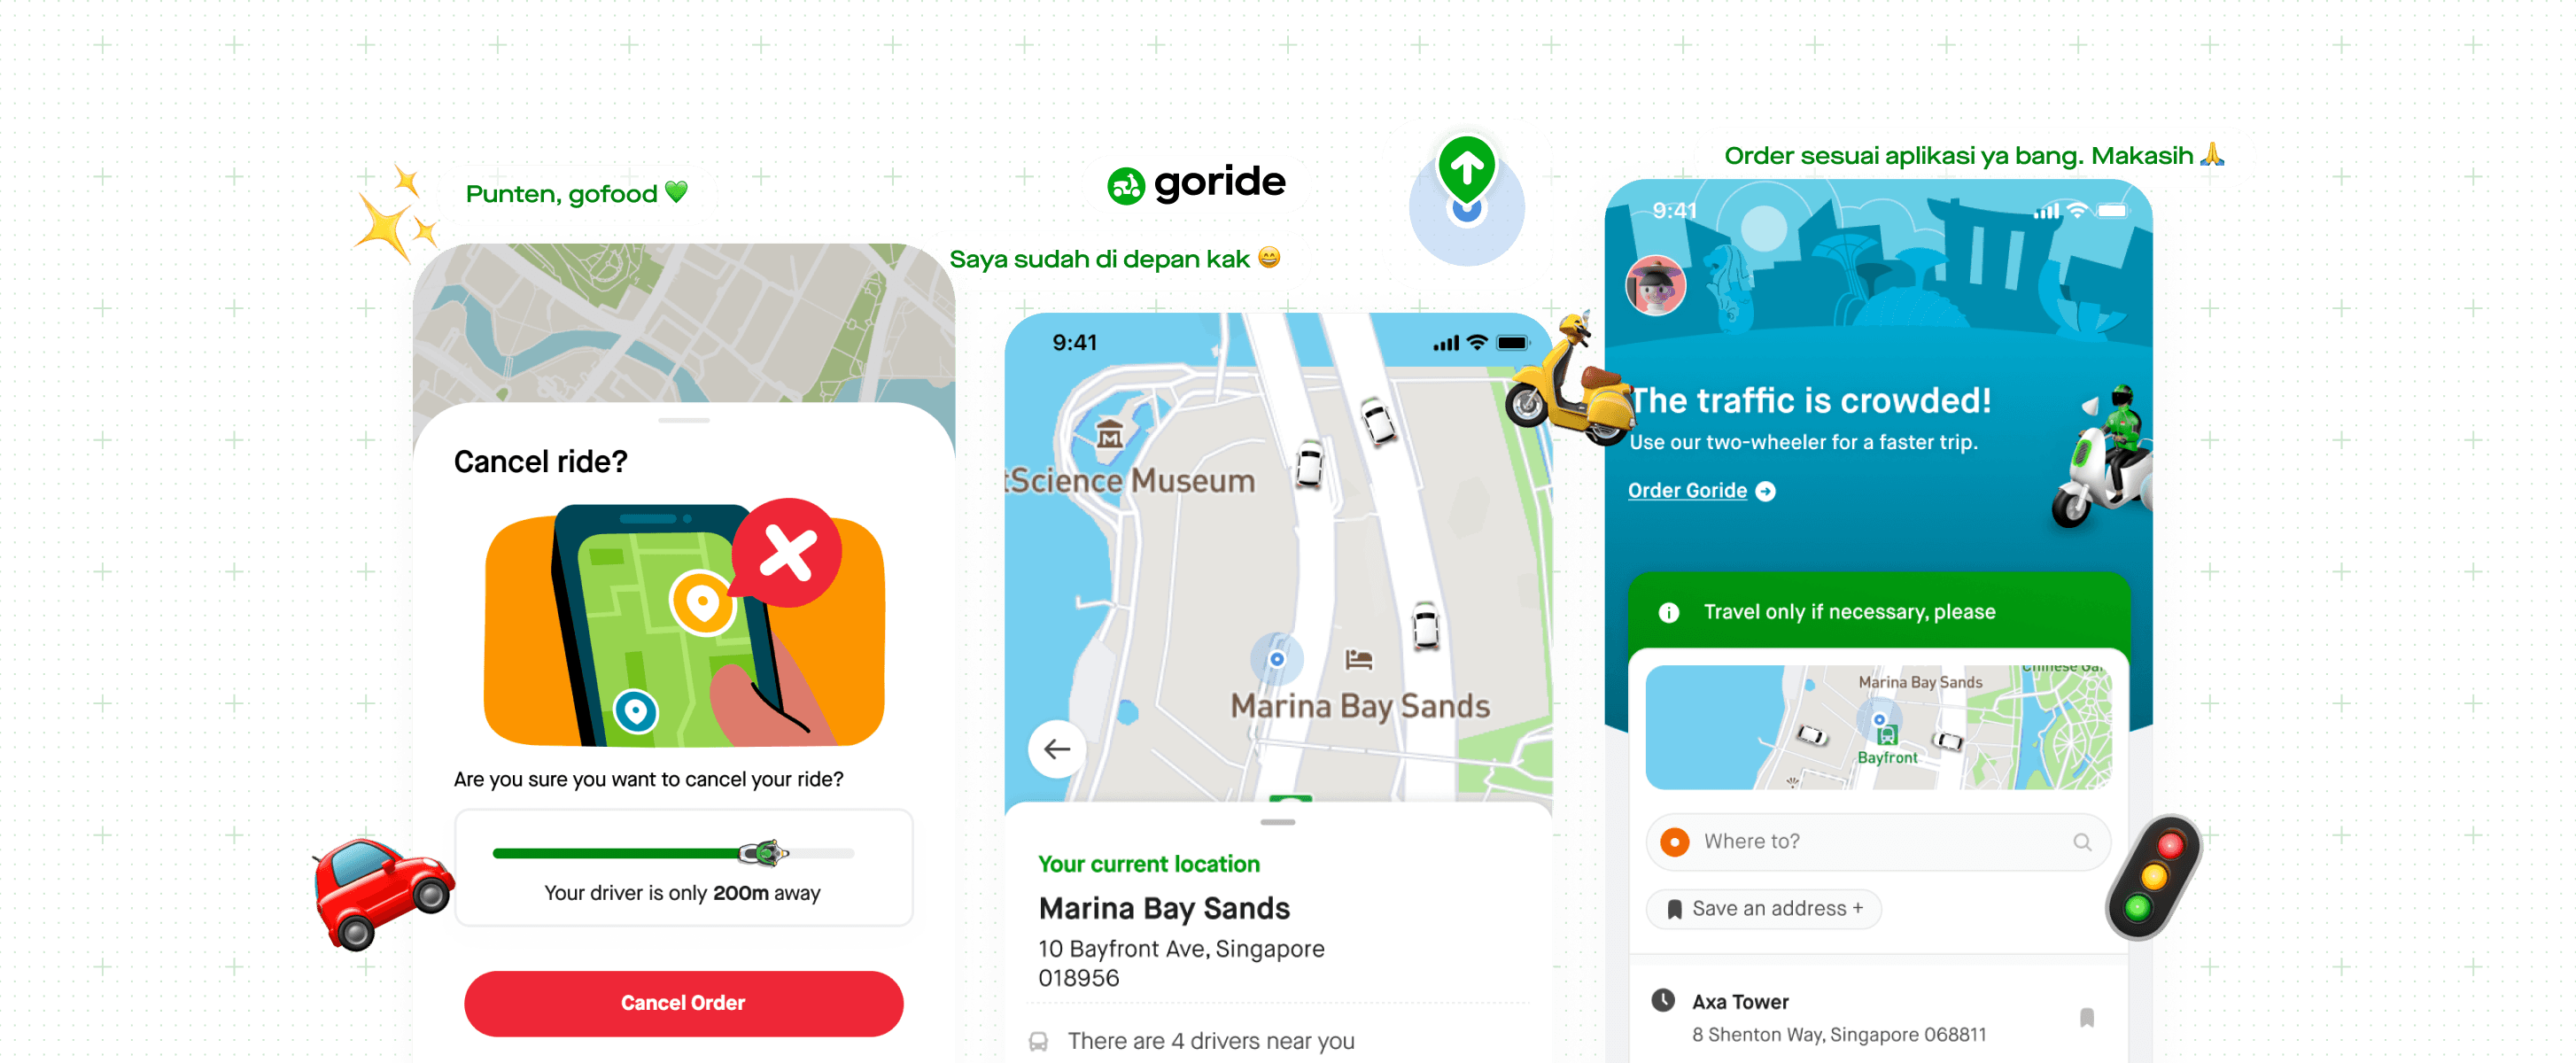
Four solutions leveraging contextual elements.
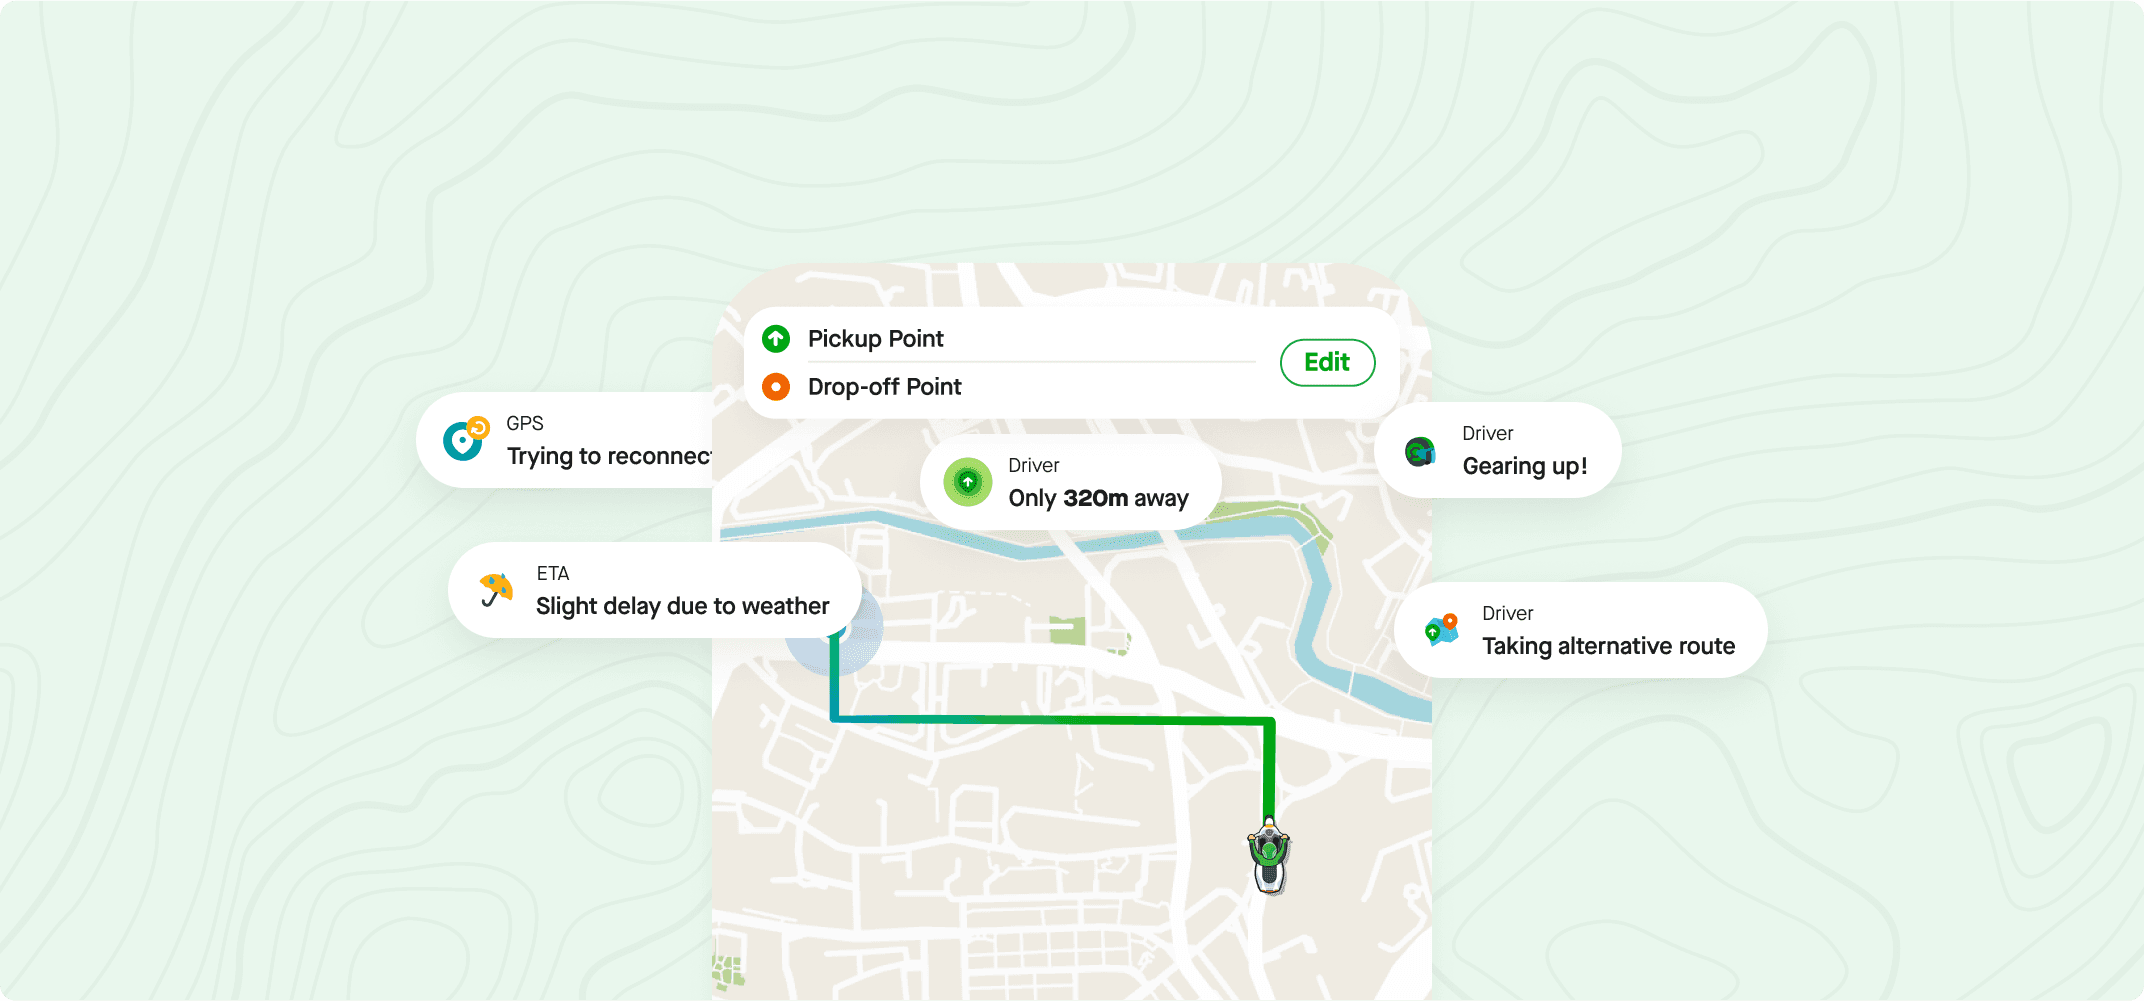
Dynamic status pill
Appearing and disappearing based on real-time triggers. This pill uses the predefined triggers to display relevant information, such as driver's distance, delays, or route changes. A subtle animation and a consistent location ensures that the pill catches the user's attention without being intrusive.
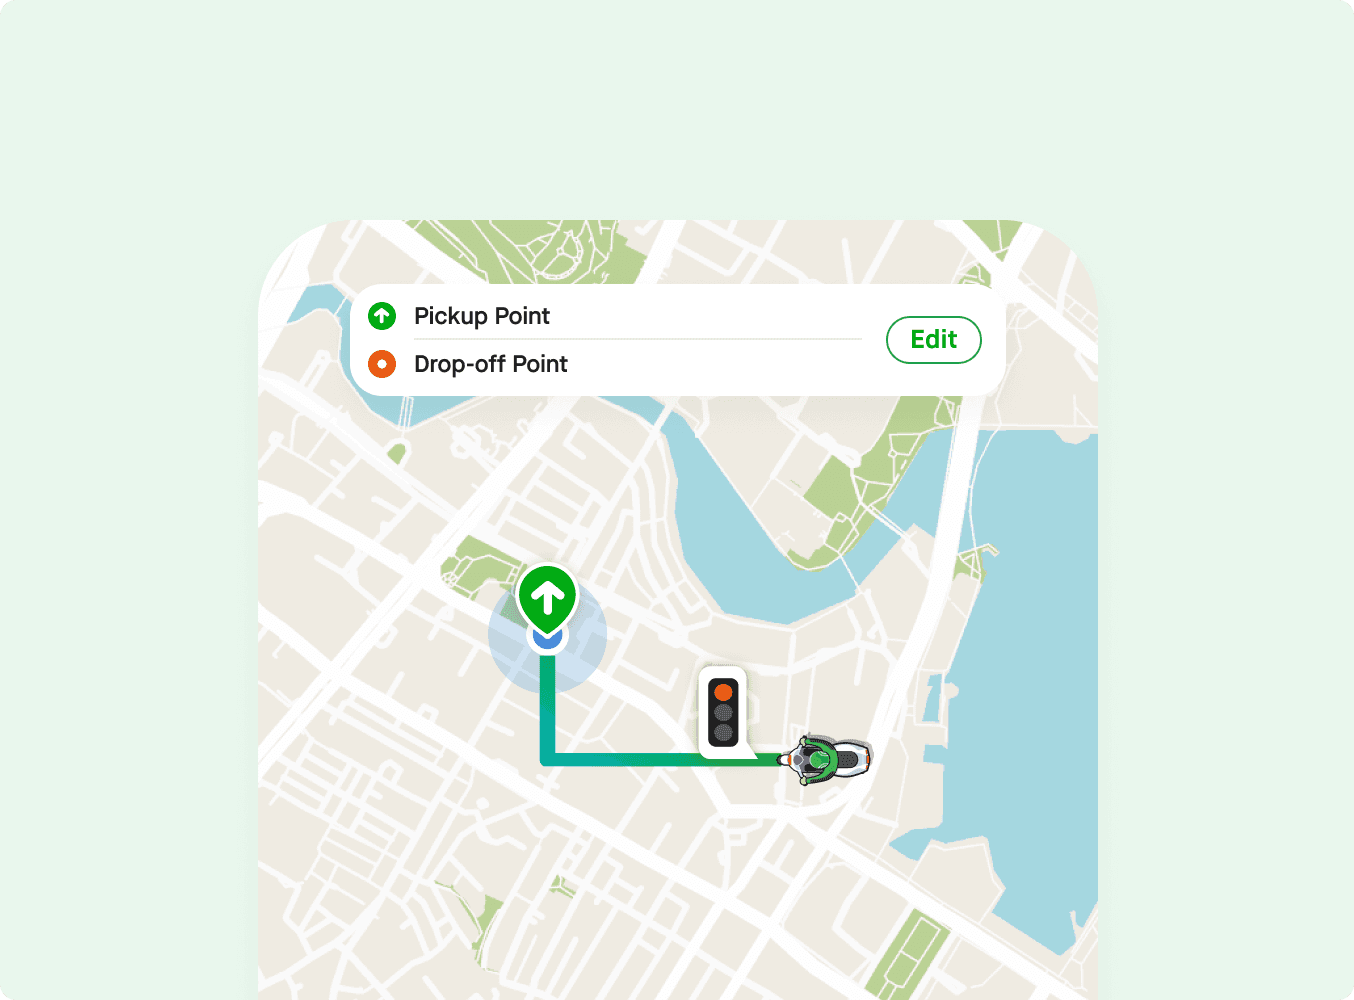
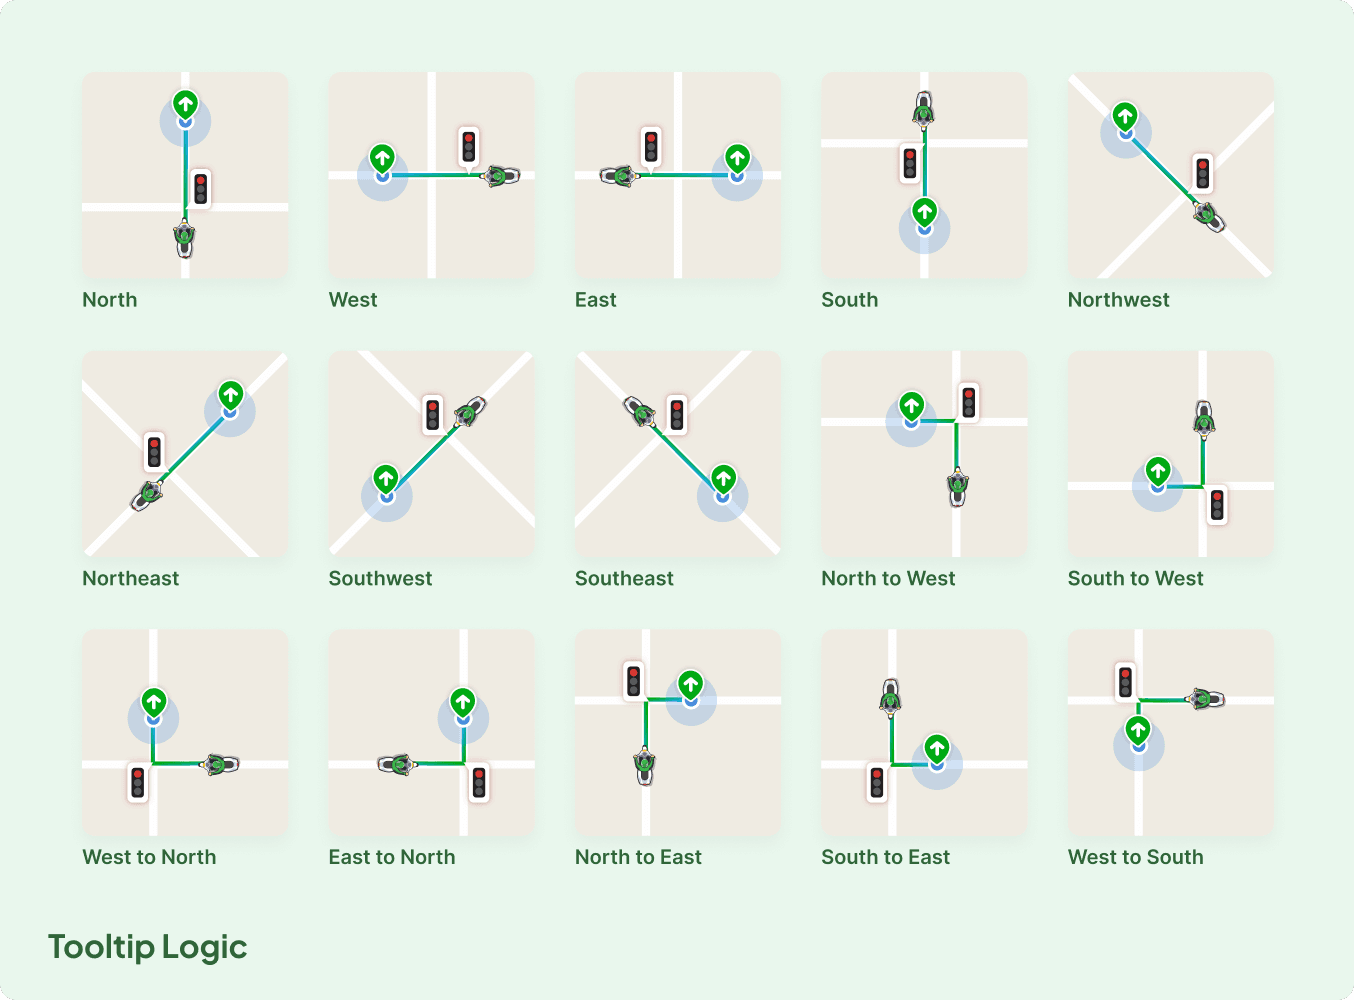
Traffic light tooltip
Appears on the map beside the vehicle icon, providing real-time updates about traffic light stops. This tooltip is triggered when the driver is stationary at a known traffic light location, based on the Indonesian database of traffic lights and exists separately from the dynamic status pill to avoid redundancy, given the frequency of traffic lights.
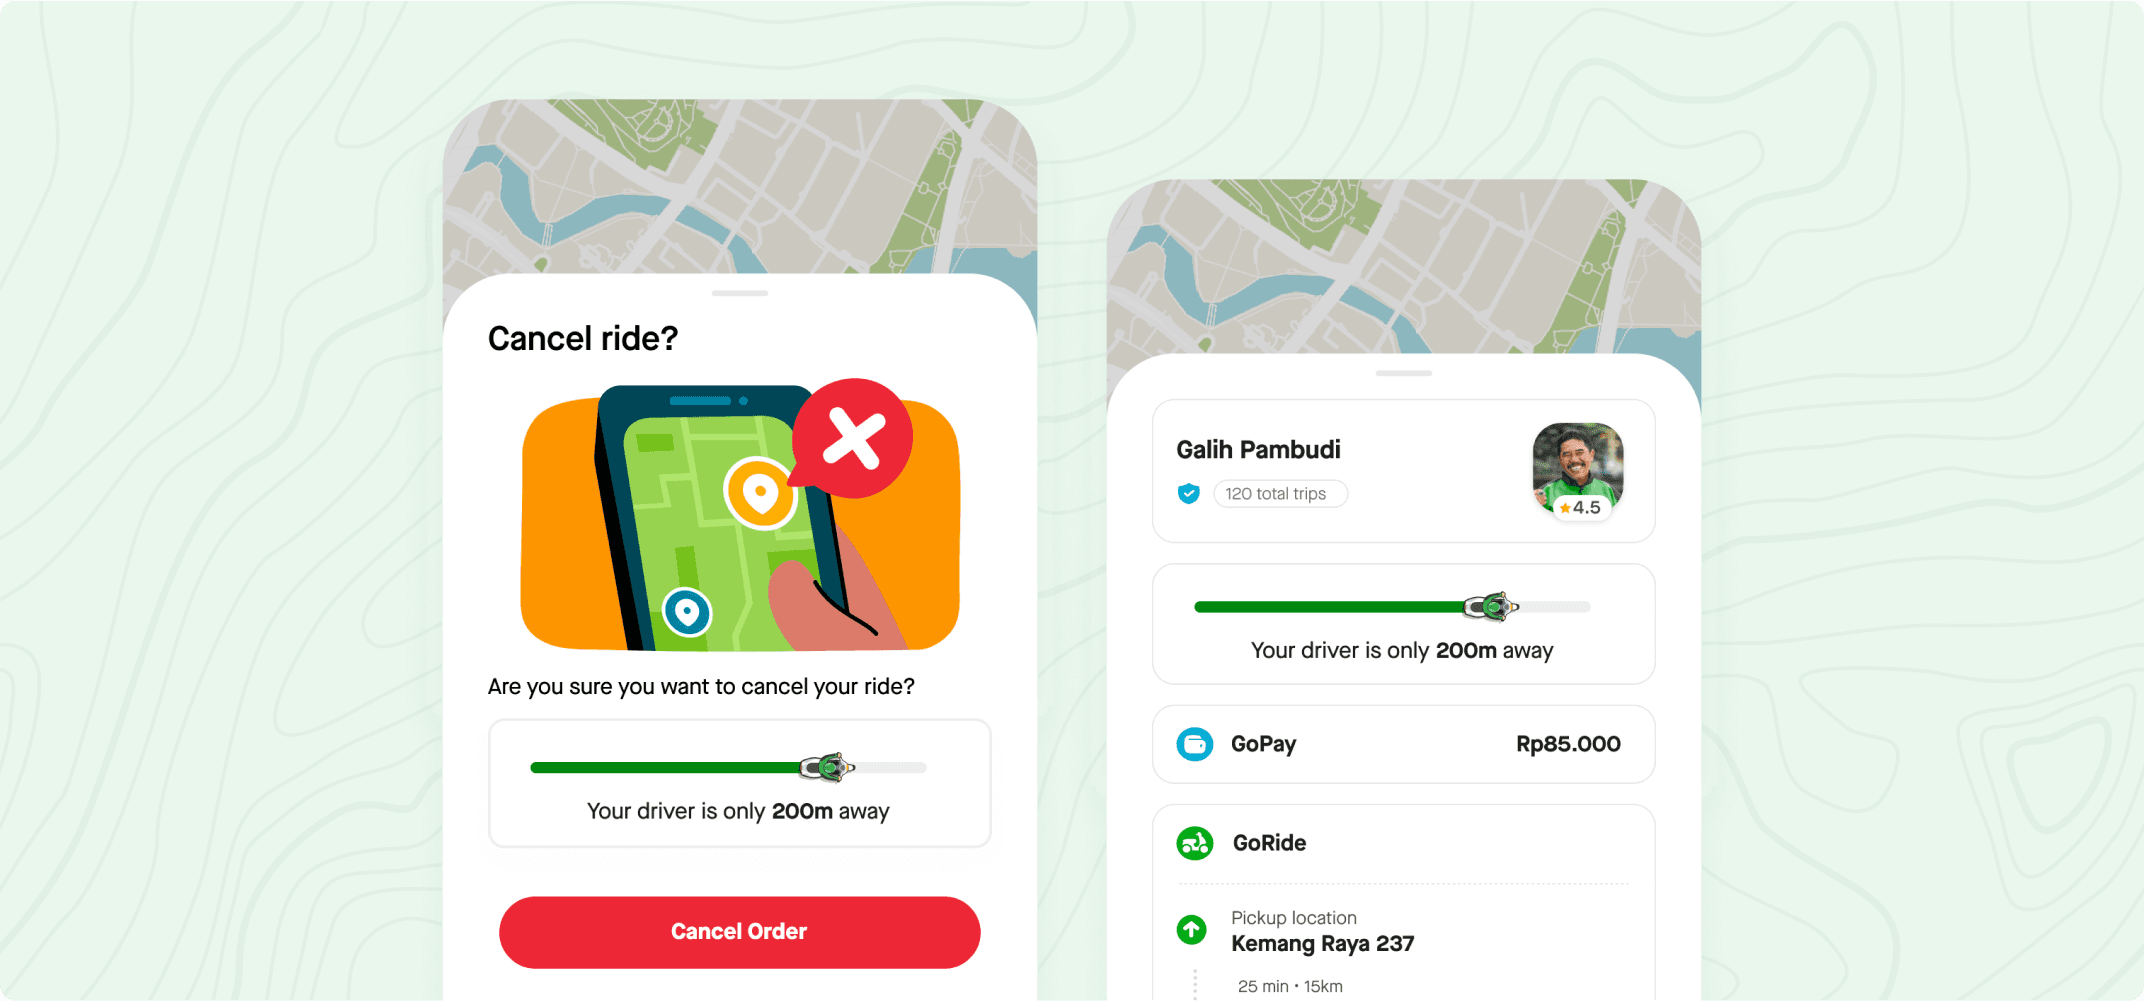
Distance progress bar
Displayed on trip summary and when users are about to cancel. This feature includes a progress bar with a moving vehicle icon and real-time distance information. The distance progress bar reassures users of the driver's proximity and helps reduce cancellations.
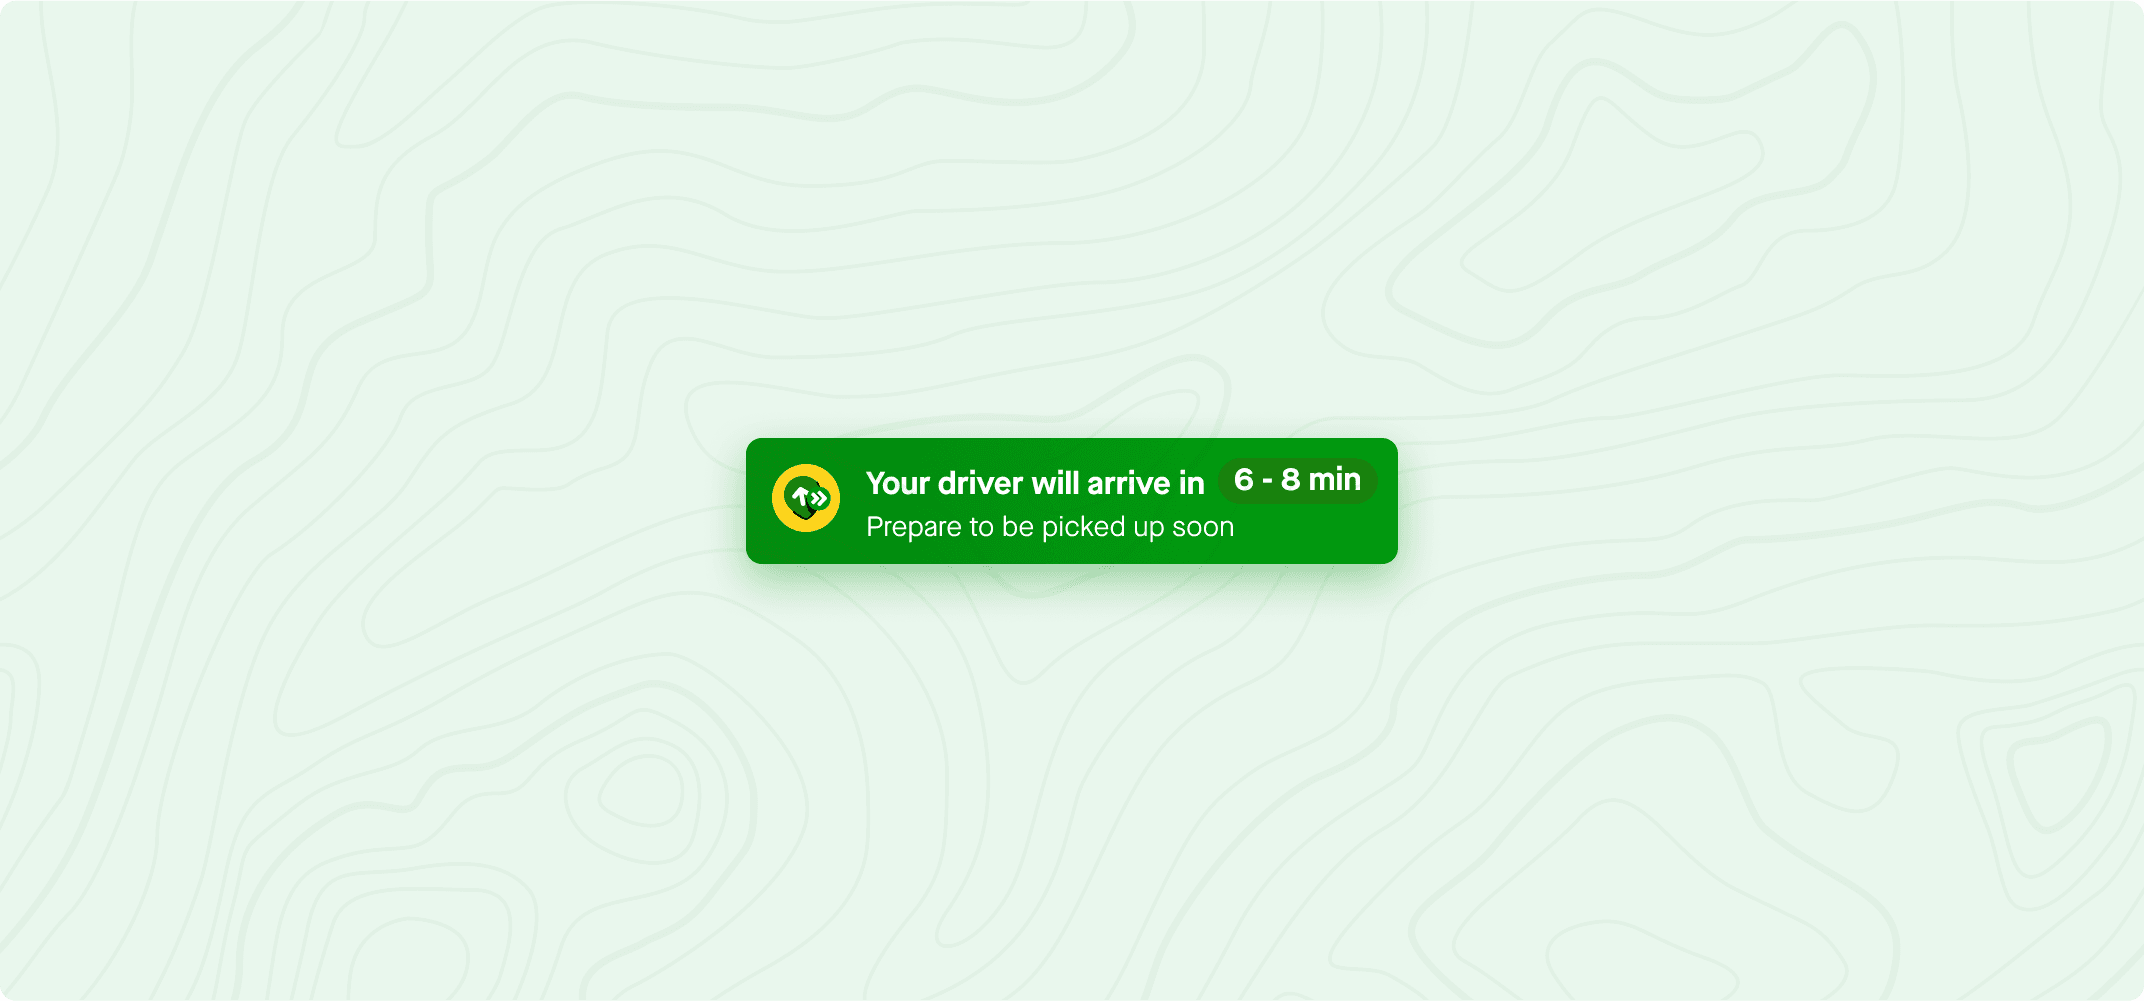
Display ETA in range
Shows the estimated time of arrival as a range rather than a precise number, offering users a more flexible perception of wait times for ETAs above 6 minutes, which research has shown to be generally considered long by people in Indonesia. This approach helps reduce user anxiety by setting more realistic expectations and accommodating potential delays.
Business Impact
Achieved a 6% reduction in order cancellations, surpassing the target OKR by 1%.
Using data collected two months after the public release of the design enhancements (Sept 2021), we exceeded the 5% OKR target for reducing user cancellations. While specific cost savings are under NDA, this 6% reduction represented substantial operational savings for Gojek given its large user base (40 million MAU), contributing significantly to the company's bottom line.

Public-Facing Impact
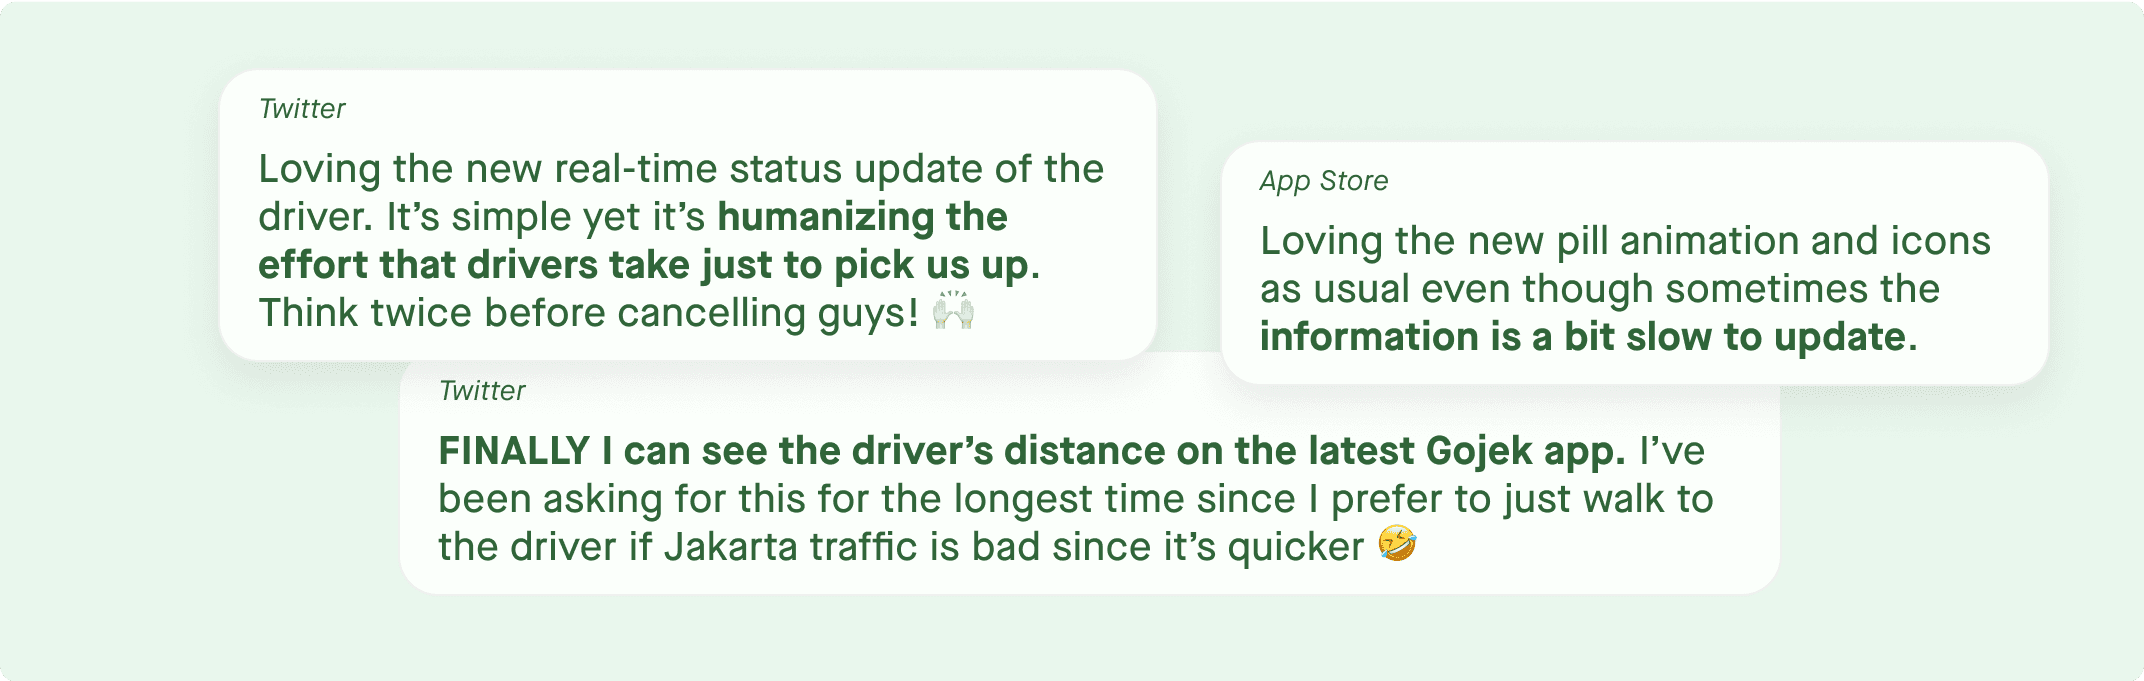
Increased user engagement by 14%, alongside positive public reception.
Users across app stores and social media praised the enhanced transparency and reliability from real-time status updates and the driver distance feature. Positive feedback was also received for the new animations and icons. These improvements signaled strong progress towards Gojek's OKR of enhancing live tracking and complemented the observed reduction in cancellations.